Ketosis Report
In the first few weeks of lactation (up to 60 DIM), cows are vulnerable to developing a negative energy balance, which can affect milk production and chances of conceiving. Accurate alerts to cases of suspected ketosis enable users to take steps to monitor cows at risk, correctly identify cows with ketosis, and treat the health issue before its impact extends. Preventing ketosis or implementing early treatment reduces the incidence and severity of the disorder and the impact this has on yield.
Risk factors for developing ketosis include:
-
Cow received 3.75 BCS or higher before her dry period.
-
Cow with an extended dry period – animal that was dried for 70 days or more.
-
Cow with more than one offspring.
-
Cow that lost 8% or more weight during the first 5 to 30 DIM (for farms with weight scale).
-
Cow with an increase in yield along with an increase in her Fat/Protein ratio (for farms with AfiLab).
Note: Ketosis detection based on high fat/protein ratio is only available in farms using AfiLabs. If the AfiLab option is not installed, the icon is disabled.
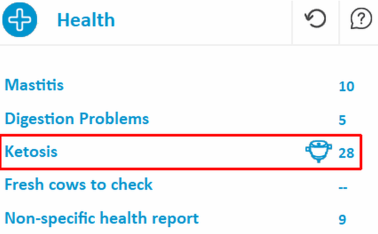
Click Ketosis on the dashboard to open the associated report (refreshed every hour).
The report lists all cows with suspected ketosis.
Understand the Suspected Ketosis Report
The report is based on extensive research that shows how the fat/protein ratio in the milk increases when the energy balance of the cow deteriorates.
In the Suspected Ketosis report, cows with a fat/protein ratio above a 1.4 threshold, in multiple milking sessions, are suspected as ketotic, and are displayed red in the table.
*Yield values in the example report are displayed in Lbs.
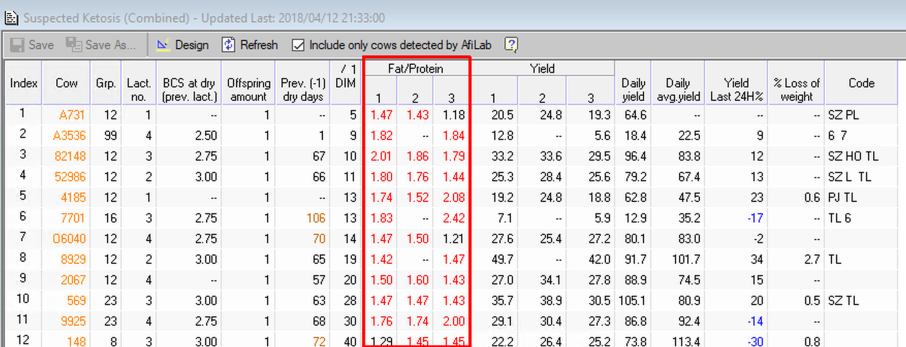
Note: Data in the report that reach their benchmarks are displayed in various colors:
|
Column |
Description |
|---|---|
|
Cow |
Displays cow number in orange if any of her risk factors exceed the threshold. |
|
BCS at dry |
Displays the cow's Body Condition Score. 1=very thin; 5 = very fat. A value of 3.75 or higher indicates a high risk of ketosis. |
|
Offspring amount |
Displays the number of offspring. Cow's with more than one offspring displayed in purple. |
|
Prev. dry days |
Displays dry days during previous lactation. Dry days of 70 or over are marked in color. |
|
Fat/Protein |
Displays the fat/protein ratio for the last sessions. Ratios that exceed their threshold are displayed in red. For more information see Detect Sub-Acute Ruminal Acidosis, Monitor Herd Fat/Protein Ratio , and Verify Causes of Nutritional Imbalances |
|
Yield |
Displays cow's production for each session. |
|
Daily Yield |
Displays cow's total milk production for last completed milking sessions (in last 24 hours). |
|
Daily Average Yield |
Displays cow's average yield for last 10 days. |
|
Yield Last 24H (%) |
Displays cow's percentage yield deviation, based on 10-day average. Deviations that exceed their thresholds are displayed blue. Deviations that exceed the thresholds are a good indication of clinical ketosis. Alone, this deviation does not cause the cow to be included in the report. For this, it must be accompanied by a decline in yield. |
|
% Loss of weight |
Displays, in percentage, the cow's average weight in comparison to her average weight for the last 5 DIM. Deviations that exceed the threshold are displayed red. |
Note: Farms with AfiFeed installed can assign an automatic ketosis menu to cows at risk, see Ketosis Menu
Before Ketosis treatment is set, the Ketosis Treatment icon is red.

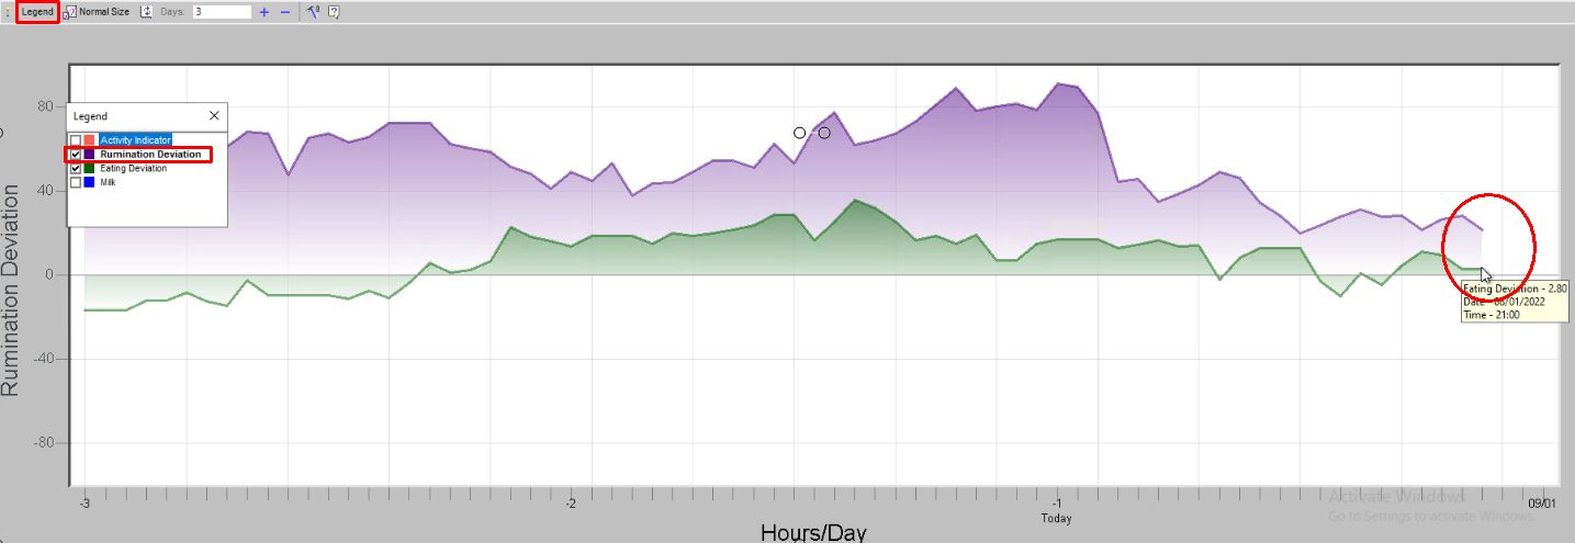
Understand the graph
Click a specific row in the Detailed Report to open the animal's behavior deviations for the last 3 days, in a graph view.
Note: On the Activity Indicator axis, 0 represents average standard eating, rumination and activity behavior for the specific animal. Graph legends above 0 indicate above average amount of time spent eating/ruminating/activity, while graph legends that dip below 0 indicate a decrease in the average amount of time spent on the behavior.
The graph displays hourly deviations in the cow's standard eating, rumination and activity behavior, and her milk production. Open the Legend dialog box, then click one of the legend options to view deviations to that behavior.
The example below displays decreases in her rumination and eating, further confirmation she may have ketosis.
In the first few weeks of lactation (up to 60 DIM), cows are vulnerable to developing a negative energy balance, which can affect milk production and chances of conceiving. Accurate alerts to cases of suspected ketosis enable users to take steps to monitor cows at risk, correctly identify cows with ketosis, and treat the health issue before its impact extends. Preventing ketosis or implementing early treatment reduces the incidence and severity of the disorder and the impact this has on yield.
Risk factors for developing ketosis include:
-
Cow received 3.75 BCS or higher before her dry period.
-
Cow with an extended dry period – animal that was dried for 70 days or more.
-
Cow with more than one offspring.
-
Cow that lost 8% or more weight during the first 5 to 30 DIM (for farms with weight scale).
-
Cow with an increase in yield along with an increase in her Fat/Protein ratio (for farms with AfiLab).
Note: Ketosis detection based on high fat/protein ratio is only available in farms using AfiLabs. If the AfiLab option is not installed, the icon is disabled.
Click Ketosis on the dashboard to open the associated report (refreshed every hour).
The report lists all cows with suspected ketosis.
Understand the Suspected Ketosis Report
The report is based on extensive research that shows how the fat/protein ratio in the milk increases when the energy balance of the cow deteriorates.
In the Suspected Ketosis report, cows with a fat/protein ratio above a 1.4 threshold, in multiple milking sessions, are suspected as ketotic, and are displayed red in the table.
*Yield values in the example report are displayed in Lbs.
Note: Data in the report that reach their benchmarks are displayed in various colors:
|
Column |
Description |
|---|---|
|
Cow |
Displays cow number in orange if any of her risk factors exceed the threshold. |
|
BCS at dry |
Displays the cow's Body Condition Score. 1=very thin; 5 = very fat. A value of 3.75 or higher indicates a high risk of ketosis. |
|
Offspring amount |
Displays the number of offspring. Cow's with more than one offspring displayed in purple. |
|
Prev. dry days |
Displays dry days during previous lactation. Dry days of 70 or over are marked in color. |
|
Fat/Protein |
Displays the fat/protein ratio for the last sessions. Ratios that exceed their threshold are displayed in red. For more information see Detect Sub-Acute Ruminal Acidosis, Monitor Herd Fat/Protein Ratio , and Verify Causes of Nutritional Imbalances |
|
Yield |
Displays cow's production for each session. |
|
Daily Yield |
Displays cow's total milk production for last completed milking sessions (in last 24 hours). |
|
Daily Average Yield |
Displays cow's average yield for last 10 days. |
|
Yield Last 24H (%) |
Displays cow's percentage yield deviation, based on 10-day average. Deviations that exceed their thresholds are displayed blue. Deviations that exceed the thresholds are a good indication of clinical ketosis. Alone, this deviation does not cause the cow to be included in the report. For this, it must be accompanied by a decline in yield. |
|
% Loss of weight |
Displays, in percentage, the cow's average weight in comparison to her average weight for the last 5 DIM. Deviations that exceed the threshold are displayed red. |
Note: Farms with AfiFeed installed can assign an automatic ketosis menu to cows at risk, see Ketosis Menu
Before Ketosis treatment is set, the Ketosis Treatment icon is red.